|
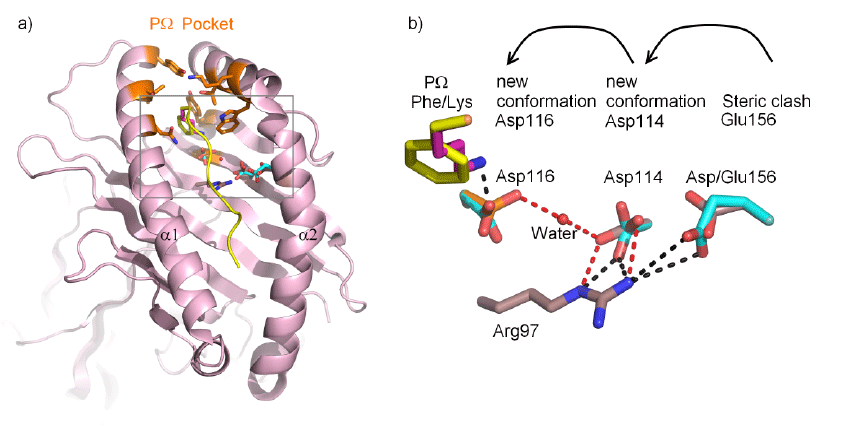
| Figure 10: Molecular modelling of the HLA-B*44:35156Glu micropolymorphism. 10a) Structural comparison of the HLA-B*44:02156Asp and HLA-B*44:35156Glu variants. A view is shown of the peptide binding groove with the HLA heavy chain represented as ribbons. Highlighted as sticks is the pΩ peptide anchor (yellow/ dark pink), the residues comprising the pΩ binding pocket (orange), residues 156Glu, 114Asp and 116Asp from the HLAB* 44:35156Glu model are coloured cyan. b) A close up view of the molecular details depicted in a), the steric clash by introducing 156Glu disrupts the 97Arg-114Asp-water-116Asp hydrogen bonding network (red dashes) by forcing a conformational change in 114Asp. 116Asp is then more likely to be in a receptive conformation to accept Lys as a pΩ anchor residue. |