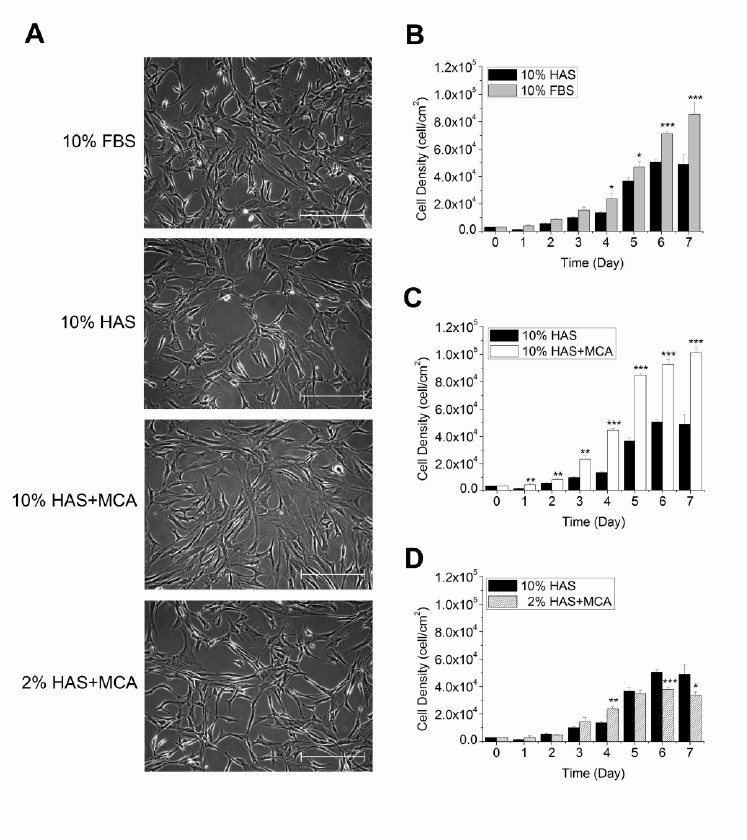
(A) Direct visualization of cell culture and cell morphology on day 3. Bar=500 µm. ADSC proliferation were examined by a time course of cell densities under the 10% FBS, 10% HAS, 10% HAS+MCA and 2% HAS+MCA conditions between days 0-7.
(B) 10% FBS vs. 10% HAS.
(C) 10% HAS+MCA vs. 10% HAS alone.
(D) 2% HAS+MCA vs. 10% HAS alone. Data are shown as mean ± SD (n=3). *p<0.05. **p<0.01. ***p<0.005.