 |
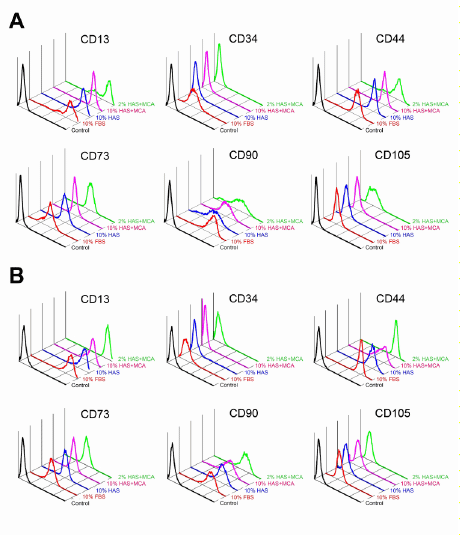
| Figure 7: The phenotype of ADSCs at day 6 following culturing in respective culture media. Black lines indicate background (control) signals; colored lines represent the expression of each indicated cell surface markers during (A) passage 1, and (B) passage 2. |