 |
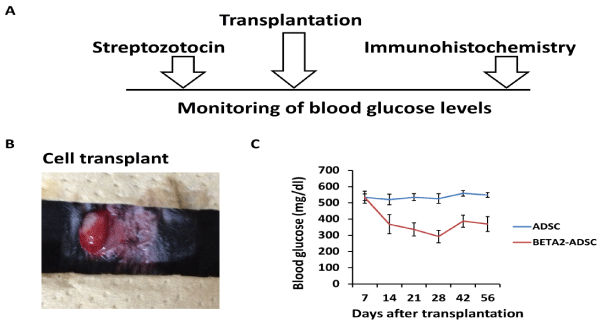
| Figure 4: Blood glucose levels and survival of streptozotocin-treated diabetic mice. (A) A schematic representation of in vivo transplantation. (B) Representative cell transplant under the left kidney capsule. (C) Blood glucose levels of STZ-treated mice after cell transplantation. Comparison of blood glucose levels in ADSCtransplanted mice (blue, n = 4) and BETA2-ADSC-CM-transplanted mice (red, n = 4). Data are presented as mean ± SEM. |