 |
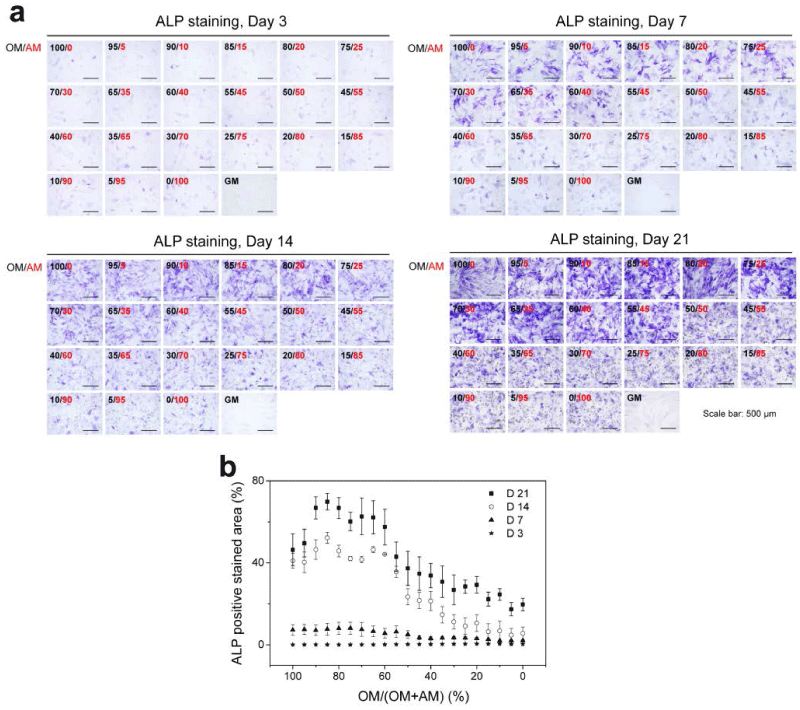
| Figure 2: (a) Photomicrographs of ALP staining of MSCs after culture in different ratio of osteogenic medium (OM) and adipogenic medium (AM) for 3, 7, 14, and 21 days. 100/0 indicates the medium containing 100% OM and 0% AM, and so forth. GM indicates the growth medium. Scale bar=500 μm. (b) Percentage of cells that were positively stained with ALP after culture in different ratio of OM and AM for 21 days. Data represent mean ± SD (n ≥ 30, n represents the total number of images taken from 3 triplicate wells with more than 10 images from each well). |