 |
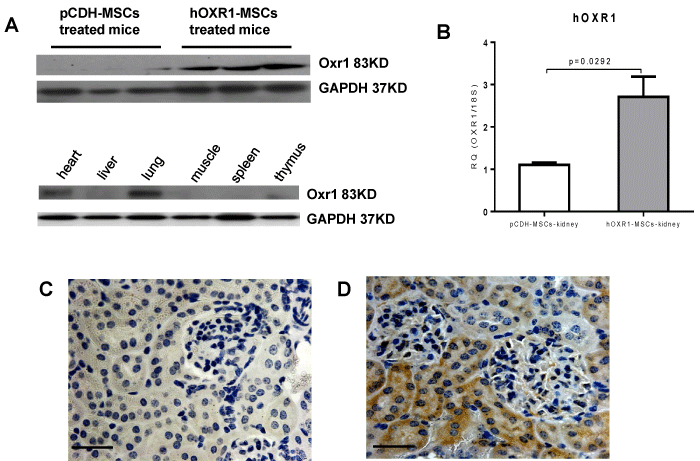
| Figure 4: hOXR1 expression in vivo after hOXR1-MSC injection into the mice. (A) hOXR1 expression in kidney and other organs by western blot. (B) hOXR1 mRNA expression in kidney by QPCR (n=3 in each group). (C-D) Representative image of hOXR1 expression in mouse kidney tissue section of pCDH-MSCs treated mice (C) and hOXR1-MSCs treated mice (D). (Original magnification 400X, scale bars=50 μm). shown images are representative of 5 samples per group. |