 |
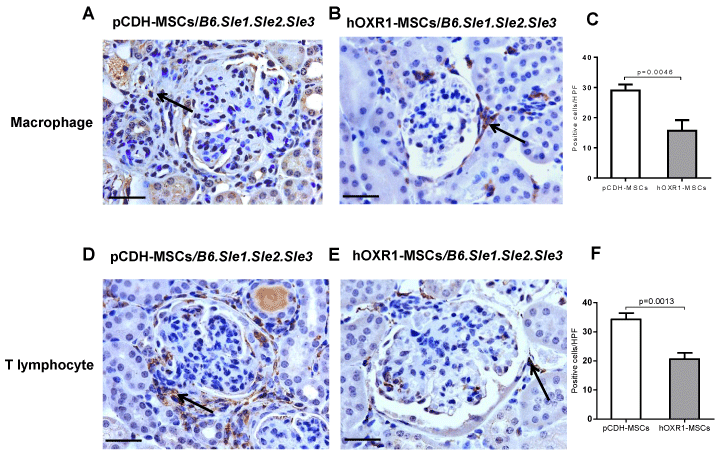
| Figure 8: Macrophages and T lymphocyte infiltration into lupus kidneys. (A-B) Iba1 staining for macrophage infiltration into the kidneys of pCDH-MSCs or hOXR1- MSCs treated B6.Sle1.Sle2.Sle3 mice. (C) Quantitative analysis of Iba1 positive cells in the kidney. The number of Iba1 positive cells in the kidney of hOXR1-MSCs treated mice was significantly less than that in pCDH-MSCs treated mice (p< 0.05). n=5 mice per group. (D-E) CD3 staining for T lymphocyte infiltration into the kidneys of pCDH-MSCs or hOXR1-MSCs treated B6.Sle1.Sle2.Sle3 mice. (F) Quantitative analysis of CD3 positive cells in the kidney. The number of CD3 positive cells in the kidney of hOXR1-MSCs treated mice was significantly less than that in pCDH-MSCs treated mice (p< 0.05). (Original magnification 400X, scale bars=50 μm). n=5 mice per group. |