 |
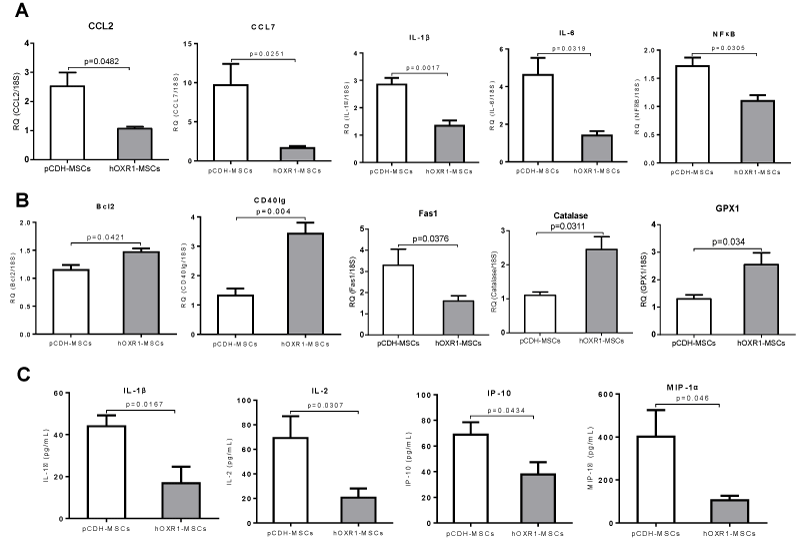
| Figure 11: Expression level of inflammatory cytokines and antioxidants in kidneys of B6.Sle1.Sle2.Sle3 mice after treatment. (A) Differential expression of inflammatory cytokines in the kidney of pCDH-MSCs or hOXR1-MSCs treated mice by QPCR (p< 0.05, n=5 in each group). (B) Differential expression of apoptosis-associated genes and antioxidant genes in kidneys of mice treated with pCDH-MSCs or hOXR1-MSCs by QPCR (p< 0.05, n=5 in each group). (C) Down-regulation of expression of cytokines in serum of mice treated with hOXR1-MSCs compared with control mice (p< 0.05, n=3 in each group). |