|
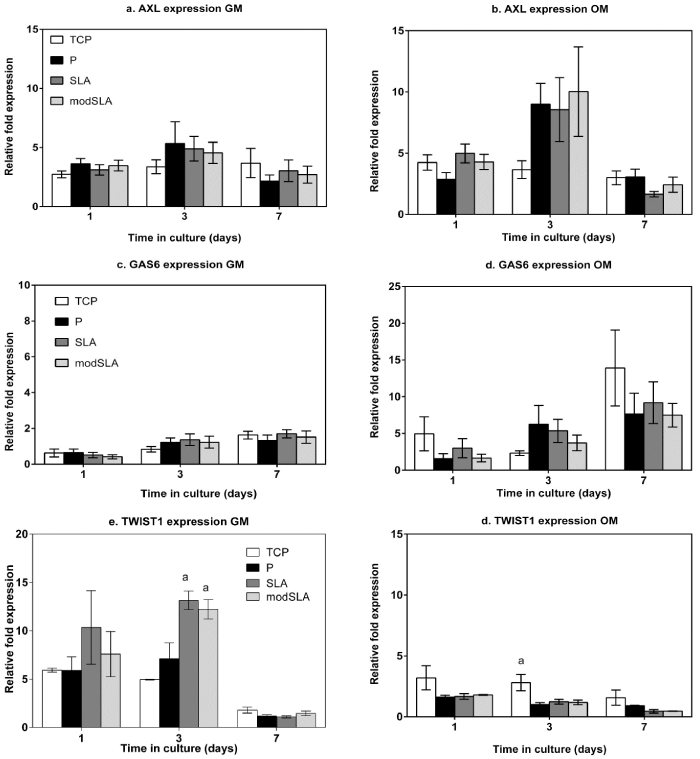
| Figure 1: Gene expression assayed in hMSCs were cultured in growth (GM) or osteogenic (OM) media on TCP, P, SLA and modSLA Ti surfaces at 1, 3 and 7 days post seeding showed small fold expression of all genes. AXL (a,b) and GAS6 (c,d) did not display any surface specific changes in expression, although the ligand was transcribed relatively higher in OM than GM. TWIST1 (e,f) displayed surface specific differences in expression, being significantly up-regulated by rough compared to smooth at 3 d (p<0.05) in GM. The gene was expressed at relatively higher levels on TCP than Ti at 3 d in OM. Bars represent mean + SEM; N=donors=3, n=replicates=3. a= p<0.05, TCP vs. Ti surface. |