 |
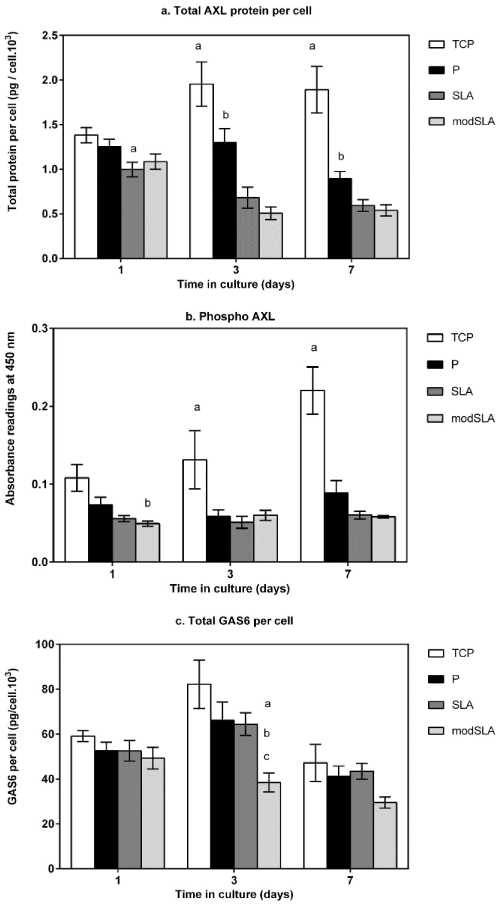
| Figure 2: Protein expression analysis of AXL, GAS6 in hMSCs cultured on all surfaces for 7 days. (a) Axl protein was detected at similar levels on all surfaces at 1 d. Total receptor protein significantly decreased on the rough by 3 and 7 days compared to smooth. This down-regulation occurred later on P surface compared to rough. (b) AXL tyrosine phosphorylation was significantly lower on Ti than TCP. (c) GAS6 was similar in all samples at 1 d and its levels increased on all surfaces except modSLA by 3 d. At 7 d GAS6 levels had reduced to below initial readings on all surfaces. Bars shows mean + 1SD; N=3, n=1. a= p< 0.05, TCP vs. Ti surface. b= p<0.05, polished P Ti vs. Rough Ti surface. c= p<0.05, SLA vs. modSLA. |