 |
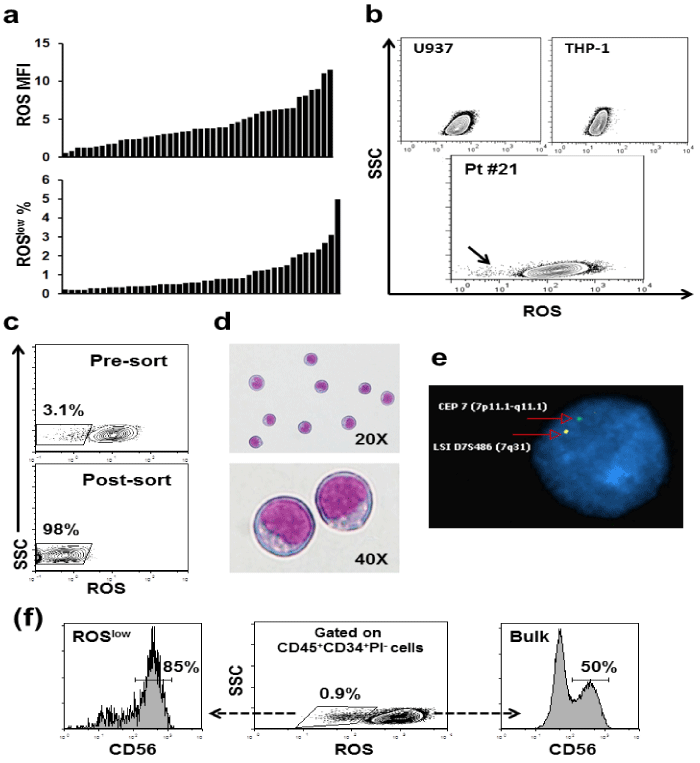
| Figure 1: Interpatient variability of redo× state in AML cells and identification of a novel ”o×idative state-low“ leukemic subpopulation. (a) Waterfall plots illustrating the distribution of values for ROS mean fluorescence intensity (MFI) and the prevalence of ROSlow cells e×pressed as percentage of total CD34+ live cells. (b) Representative flow cytometry plots of DCF/DA staining in U937 and THP-1 AML cell lines (performed in triplicates, upper plots) and in primary AML blasts (bottom plot, gated on CD45lowCD34+ live cells) showing a discrete ROSlow subpopulation only in the latter sample (arrow). (c) FACS sorting of the ROSlow subpopulation of AML blasts. Plots are gated on CD45lowCD34+ live cells. (d) Sorted ROSlow CD45lowCD34+ cells were morphologically consistent with blasts and (e) bore the characteristic cytogenetic abnormality (monosomy 7), as confirmed by FISH analysis which revealed single hybridization signal for each chromosome 7 probe (regions 7q31 and 7p11.1-q11.1) in 93.6% of nuclei. (f) The ROSlow subset is enriched in clonal cells as indicated by the high e×pression of the aberrant marker CD56 in 3 AML patients. Sorted ROSlow cells were stained with May-Grünwald-Giemsa. Photographs were taken by using a NIKON Eclipse TE2000U Inverted microscope; 20× and 40× magnifications are shown. |