 |
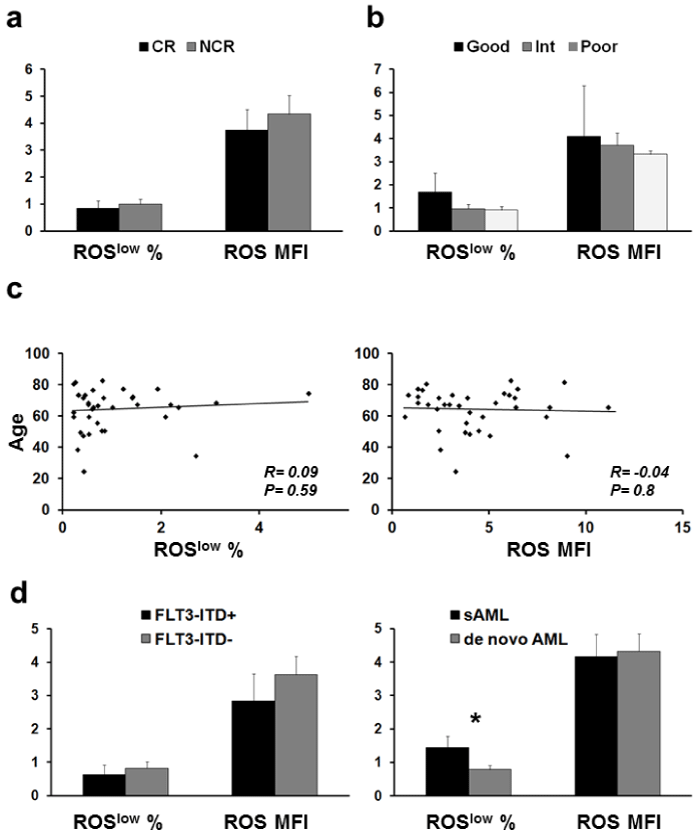
| Figure 2: The percentage of ROSlow cells and the ROS levels in CD34+ blasts are not associated with age, karyotype and response to induction chemotherapy. (a) Both the relative ROS levels in AML blasts and the percentage of ROSlow subpopulation were identical among patients with complete remission after induction therapy(CR, n=9) and those who failed CR (n=21, p=0.65 and p=0.6, respectively). The classic “7+3” regimen was administered as induction in all patients. (b) Likewise, no association exists between either ROS levels (p=0.67) or the percentage of ROSlow cells (p=0.43) and the cytogenetic risk (good=4, intermediate=16, poor=6 patients, respectively). (c) No correlation of both ROS MFI and the percentage of ROSlow cells with the age of the patients (n=44). (d) Similar prevalence of ROSlow cells and intracellular ROS levels in CD34+ blasts of FLT3-ITD positive (n=6) and negative (n=13) patients with de novo AML (left graph). By contrast, significantly higher levels of ROSlow blasts in patients with secondary AML (n=15) evolving from MDS compared to de novo AML blasts (n=29), whereas the endogenous ROS content of CD34+ blasts was identical among the two disorders (right graph). Data are expressed as mean ± SEM; *P<0.05 by unpaired t-test. |