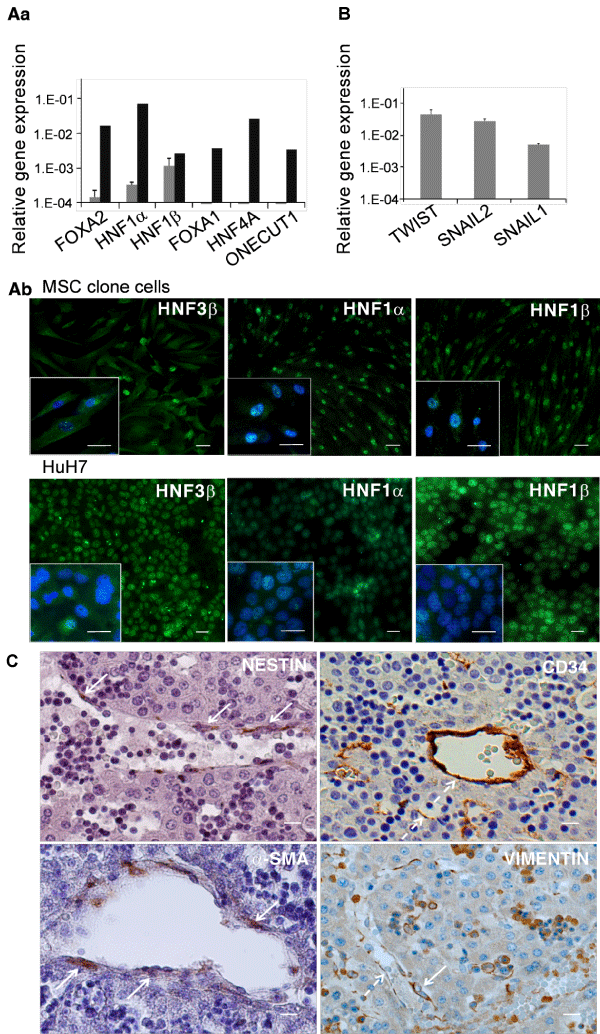
A) Hepatocytic differentiation pathway
a) Q-RT-PCR data for hepatic nuclear transcription factors in 3 clones (c4FL3, c3FL8 and c7FL8). Values are expressed as mean ± SEM of gene expression normalized to that of GAPDH (ΔCt method). Gray bars: clones; Black bars: human hepatocytic HuH7 cell line
b) Immunofluorescence using antibodies against HNF3β, HNF1α and HNF1β proteins. Upper: c7FL8; lower: HuH7, as control. Bars: 10µm.
B) Epithelial to mesenchymal transition Q-RT-PCR data for transcription factors SNAI1, SNAI2 and TWIST implicated in epithelial-to-mesenchymal transition (EMT) in 3 clones (c4FL3, c3FL8 and c7FL8). Values are expressed as mean ± SEM of gene expression normalized to that of GAPDH (ΔCt method).
C) Anatomical study
In situ marker localization of the potential cell population of origin of MSCs in human 11-12 GW fetal liver. Immunohistochemistry using antibodies against nestin, CD34, α-SM actin and vimentin. Continuous arrows indicate pericytes; broken arrows indicate endothelial lining. Bars: 10µm.