 |
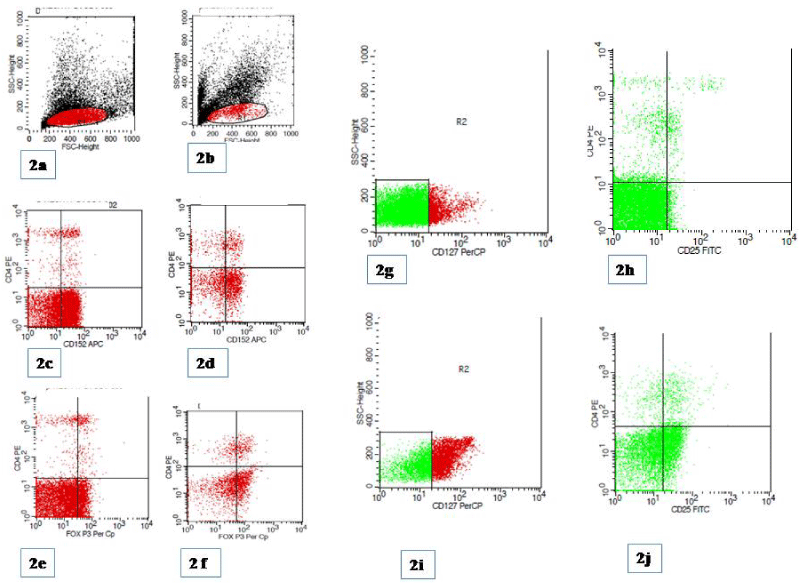
| Figure 2: Flow cytometric analysis showing T-regulatory cell characterization and generation. On left top, figure 2a with side scatter on Y axis and forward scatter on X-axis depicted by gated cluster of mononuclear cells from immunosuppressed recipients’ peripheral blood mononuclear cells and on right, figure 2b, the same depicted after in vitro generation. In figures 2c and 2d, CD4+ CD152+ cells depicted before and after in vitro generation respectively. In figures 2e and 2f, Foxp3+ cells depicted before and after in vitro generation respectively. On right, figures 2g and 2h depict CD127 low/- CD4+ CD25+/hi before in vitro generation and in figures 2i and 2j same depicted after in vitro generation. |