 |
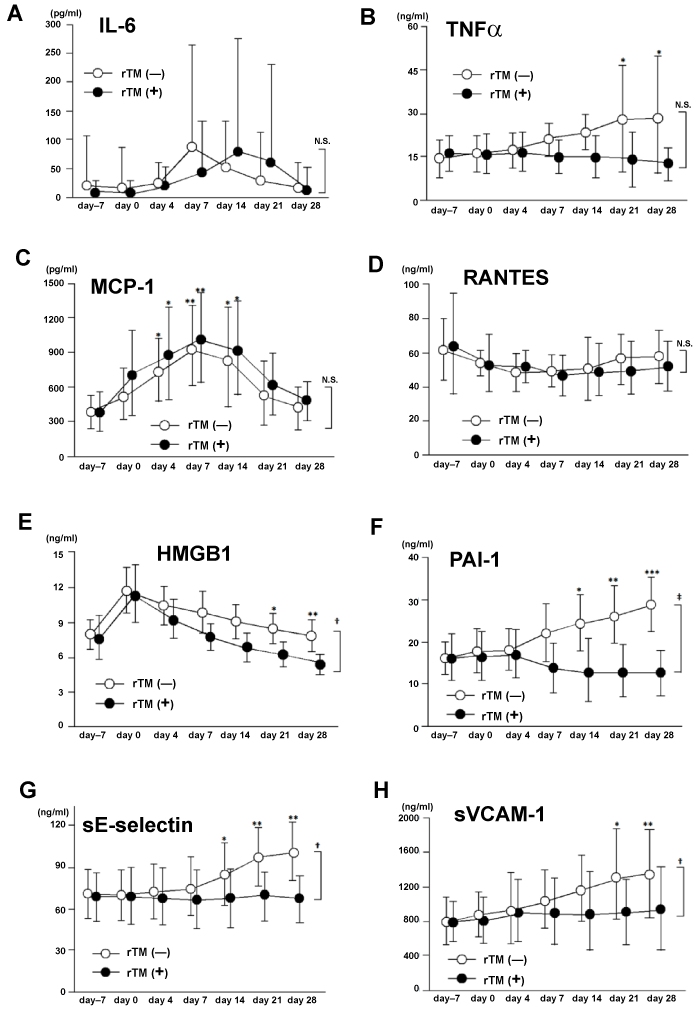
| Figure 1: The levels of selected biomarkers before and after HSCT. Concentrations of (A) IL-6, (B) TNF-α, (C) MCP-1, (D) RANTES, (E) HMGB1, (F) PAI-1, (G) sEselectin and (H) sVCAM-1 in patients with or without rTM treatment are shown. Data are shown as means ± SD. For comparisons versus day 0: *P<0.05; **P<0.01;***P<0.001. For ANOVA analysis between two groups with or without rTM treatment: †P<0.05; ‡P<0.01; NS: Not Significant. |