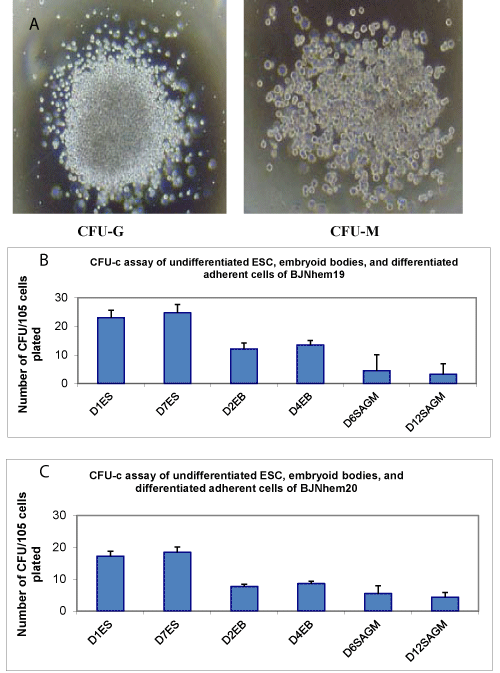
A: Photomicrographs of colonies counted at day 7 of culture in defined 3D matrix. BJNhem20 in methyl cellulose with SCF-1 in IMDM- undifferentiated ES, EBs and differentiated in SAGM (BJNhem 19) (Photograph of colonies counted and data presented for Fig.10A, was taken using Bright field phase contrast microscope : model no Olympus BX41 ,camera model no Olympus DP20 at 40X magnification)
B: CFU-c at day 7 of BJNhem19 in methyl cellulose with SCF-1 in IMDMundifferentiated ES, EBs and differentiated in SAGM (BJNhem 19) C: CFU-c at day 7 of BJNhem20 in methyl cellulose with SCF-1 in IMDMundifferentiated ES, EBs and differentiated in SAGM (BJNhem 20)