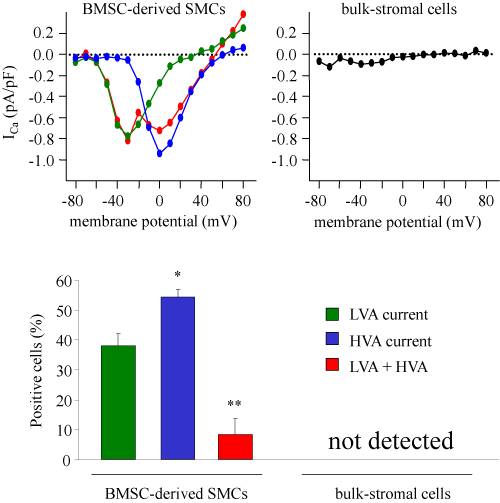
Figure 3A: The graph represents current-voltage (I-V) curves. Cells were voltage clamped at a holding potential of -80 mV, and currents were evoked by +10 mV increment depolarizing steps to +80 mV. In BMSC-derived SMCs, low voltage-activated Ca2+ current (LVA, .gif) ), high voltage-activated Ca2+ current (HVA, ), high voltage-activated Ca2+ current (HVA, .gif) ), or both LVA and HVA ( ), or both LVA and HVA (.gif) ) were recorded. In bulk-stromal cells, Ca2+ current was not detected ( ) were recorded. In bulk-stromal cells, Ca2+ current was not detected (.gif) ). The percentages of showing LVA or HVA in cells are shown in lower panel. Data are expressed as the mean ± SEM (*P<0.05, ** P<0.01 vs. LVA current of BMSC-derived SMCs). n=22 (BMSC-derived SMCs), n=5 (bulk-stromal cells). ). The percentages of showing LVA or HVA in cells are shown in lower panel. Data are expressed as the mean ± SEM (*P<0.05, ** P<0.01 vs. LVA current of BMSC-derived SMCs). n=22 (BMSC-derived SMCs), n=5 (bulk-stromal cells). |

.gif) ), high voltage-activated Ca2+ current (HVA,
), high voltage-activated Ca2+ current (HVA, .gif) ), or both LVA and HVA (
), or both LVA and HVA (.gif) ) were recorded. In bulk-stromal cells, Ca2+ current was not detected (
) were recorded. In bulk-stromal cells, Ca2+ current was not detected (.gif) ). The percentages of showing LVA or HVA in cells are shown in lower panel. Data are expressed as the mean ± SEM (*P<0.05, ** P<0.01 vs. LVA current of BMSC-derived SMCs). n=22 (BMSC-derived SMCs), n=5 (bulk-stromal cells).
). The percentages of showing LVA or HVA in cells are shown in lower panel. Data are expressed as the mean ± SEM (*P<0.05, ** P<0.01 vs. LVA current of BMSC-derived SMCs). n=22 (BMSC-derived SMCs), n=5 (bulk-stromal cells).