 |
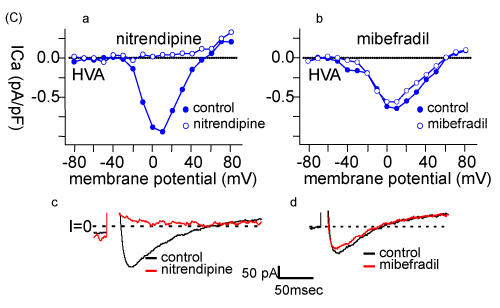
| Figure 3c: The graph (panels a and b) represents I-V curves for BMSCderived SMCs with (○) and without (●) inhibitor. Typical traces (panels c and d) show ICa elicited by depolarization to +10 mV from -80 mV with (-) or without (-) inhibitor. A selective L-type Ca2+ channel blocker nitrendipine inhibited HVA current, but it was not inhibited by a selective T-type Ca2+ channel blocker mibefradil. |