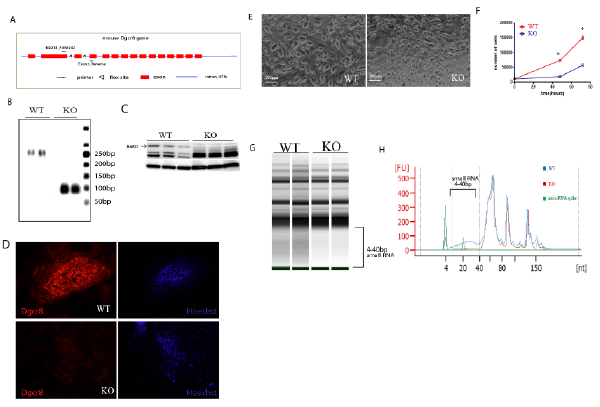
A. Illustration of the mouse Dgcr8 gene, including the locations of 2 flox sites that were used for gene targeting and the design of genotyping primers, as used in figure 1C.
B. Validation of the loss of Dgcr8 protein in the Dgcr8 KO-ESCs by Western blotting.
C. Genotyping of WT and KO ESCs with primers franking exon2 and exon4. WT display a band at 248 bp and KO at 100bp
D. Immunofluorescent staining of Dgcr8 on WT and KO ESC colonies. Note the nuclear staining of dgcr8 in the WT colony.
E. Representative images of WT and Dgcr8 KO ESCs in culture.
F. Comparison of WT and Dgcr8 KO ESC proliferation rate in culture.
G. Representative images of total RNA profiles from WT and Dgcr8 KO ESCs using bioanalyzer 2100. Note the absence of small RNA species in Dgcr8 KO ESCs, ranging from 4-40 nt long
H. Histogram of the profiles of the total RNA from WT and Dgcr8 KO ESCs using bioanalyzer 2100. Note the absent of small RNA species in Dgcr8 KO ESCs ranging from 4-40 nt long.