|
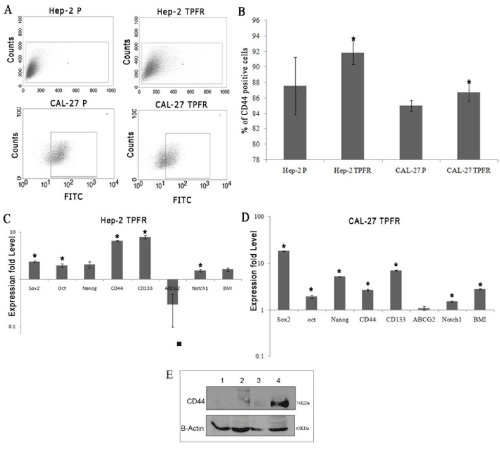
| Figure 2:Resistant cell lines show up regulation of stem cell expression(A-B). The percentage of CD44 positive cells were detected in parental and TPFR cell lines using FACS and the results are represented from 3 independent experiments. Both Hep-2 and CAL-27 TPFR cells showed a marginal increase in CD44 subpopulation relative to the parental cells. (C&D): The gene expression profile of a panel of stem cell markers in Hep-2 and CAL-27 TPFR cells. In Hep-2 TPFR cells the median increase of stem cell genes was 2.01 fold (0.28 to 7.86) and that in CAL-27 TPFR was 2.73 (range: 1.1 to 2.73). The statistically significant differences in expression are indicated (*). (E) Immunoblotting in CAL-27 P and Hep-2 P(Lanes 1 & 3) and TPFR cells (Lanes 2 & 4) showed highest level of expression in the Hep-2 TPFR cell lines. B-actin expression is shown as the control. |