 |
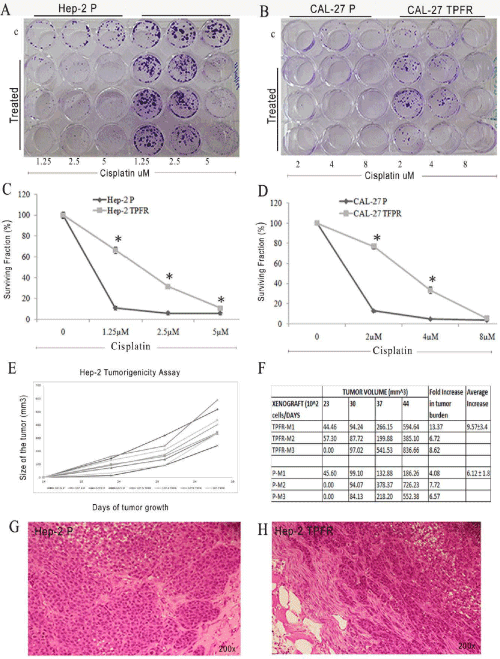
| Figure 4: TPFR cells showed increased clonogenic and in vivotumorigenic properties(A&B) The number of clones survived after cisplatin treatment in Hep-2 (A) and Cal-27 (B) P and TPFR cells. Hep-2 TPFR (Lane 4-6: 1.2uM, 2.5uM & 5uM) cells were more clonogenic than Hep-2 P cells (lane: 1-3 treated).CAL-27 P (Lane 1-3) and TPFR cells (lane 4-6) when treated with increasing concentration of cisplatin (2uM, 4uM & 8uM), TPFR cells produced more number of clones. In both the cell lines increasing cell numbers were used in each lane; 200 (lane 1, 4), 400 (lane 2, 5) and 800 (lane 3, 6). The controls (c) lane represented untreated cells of CAL-27 P and TPFR cells (100 cells). (C&D): Survival fraction of colonies are presented as graphs for Hep-2 and CAL-27 parental and TPFR cells. Statistically significant results are indicated by asterix (p<0.05) (E) Tumour burden of the Hep-2 TPFR cells: serial cell numbers from 10^5 to 10^2 cells mixed with matrigel were injected subcutaneously into the SCID mice and tumour formation was observed for 37 days. TPFR cells showed increased tumour burden with all cell numbers injected. (F) The table representing the tumour volume/ at 10^2 cells at different time points (N=3) till 44 days. The representative H&E staining (magnification 200X) of the tumour is showing the histology of the tumours generated by Hep-2 P (G) and Hep-2 TPFR (H). |