 |
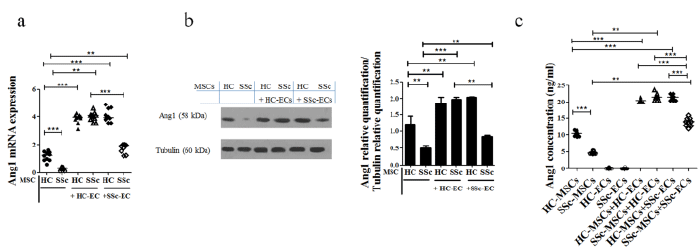
| Figure 2:Production of Ang1 in MSCs co-cultured with HC- and SSc-ECs. The pictures show the quantification by Real-time polymerase chain reaction of Ang1 (a) mRNA levels in HCs- and SSc-MSCs, sorted after co-culture with ECs. SSc-MSCs, cultured alone, expressed lower amount of Ang1 when compared to HC-MSCs. In each co-culture condition a significantly increase of the Ang1 mRNA levels was observed, compared to the expression when cells were cultured alone, a lower but still significant increase of Ang1 mRNA levels was observed in the SSc-MSCs/SSc-ECs coculture (*p=0.008; **p=0.0002; ***p<0.0001). (b) Western blot analyses: these results confirm, at protein level, those observed by qRT-PCR analyses. Pictures are representative of all experiments. Tubulin was measured as a loading control for normalization. (*=p=0.008, **=p=0.0002, ***=p=0.0001). (c) Ang1 ELISA assays. Ang1 were quantified in the supernatants of both single cultures and co-culture conditions. The results mirrored those observed by qRT-PCR and western blot analysis(**=p=0.0002; ***=p<0.0001). |