|
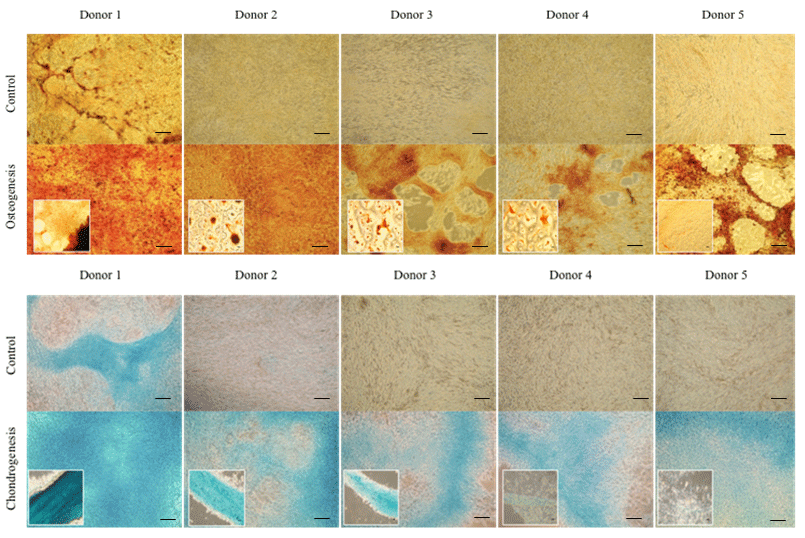
| Figure 6: Osteogenesis and chondrogenesis differentiation assays. In vitro osteocyte differentiation (top panel) of eBMMSCs from donors 1–5. Images depict osteocyte differentiation in the presence of PRP. Mineralized nodules were visible as cells differentiated into osteocytes. Cells were fixed and stained red with Alizarin red on day 7 post differentiation. The lower panel depicts undifferentiated (control) cells in presence of PRP. Note the lack of mineralized nodules in the control cells. The insets shown in this figure demonstrate the differentiation in the absence of PRP. These data is adapted from the report published earlier. Scale bar=100 μm. In vitro chondrocyte differentiation (bottom panel) of eBMMSCs from donors 1–5. Images depict chondrocyte differentiation in the presence of PRP. Cell aggregates were visible as cells differentiated into chondrocytes. Cells were fixed and stained red with Alcian blue on day 7 post differentiation. The lower panel depicts undifferentiated (control) cells in presence of PRP. Note the lack of cell aggregates in the control cells. The insets shown in this figure demonstrate the differentiation in the absence of PRP. These data is adapted from the report published earlier [25]. Scale bar=100 μm. Note the significant improvement in the osteocyte and chondrocyte differentiation patterns in presence of PRP. |