 |
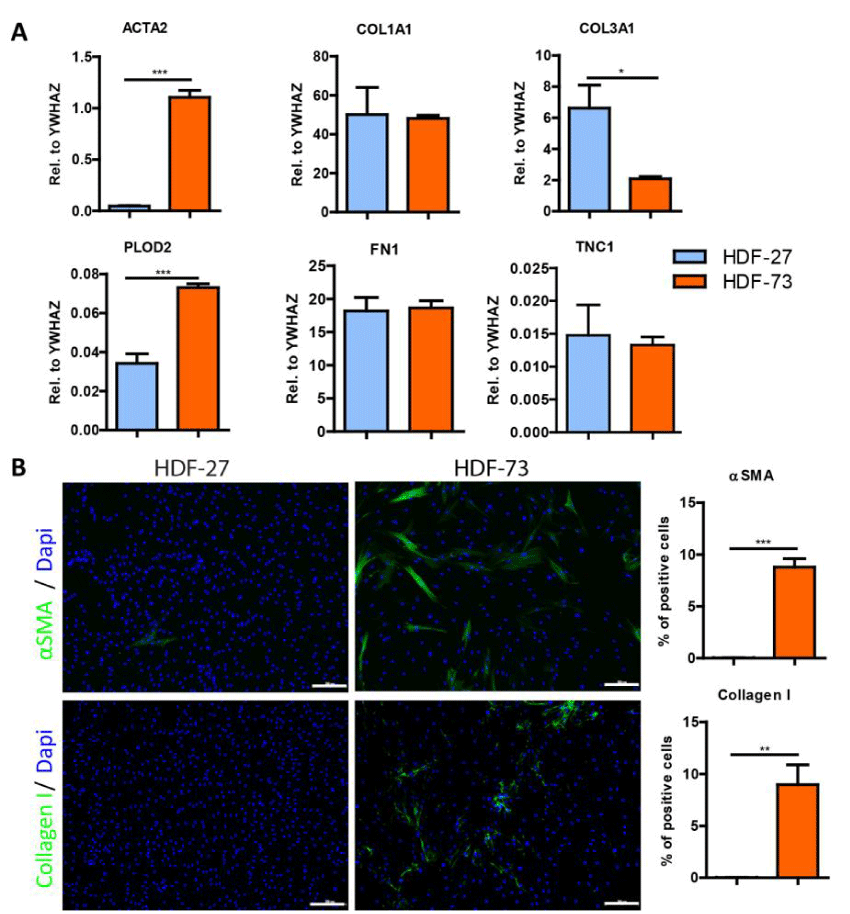
| Figure 1: Basal expression of fibrosis-related molecules in HDF-27 and HDF-73. Fibroblasts were cultured for 48 h to measure gene and protein expression. (A) mRNA levels of ACTA2, COL1A1, COL3A1, PLOD2, FN1, and TNC1 were measured with qRT-PCR and expressed relative to the reference gene YWHAZ. (B) Representative immunofluorescence stainings and quantification of the % of cells positive for α-smooth muscle actin (upper panel) and collagen type I (lower panel) are shown for HDF-27 and HDF-73. White scale bar represents 200 μm. |