 |
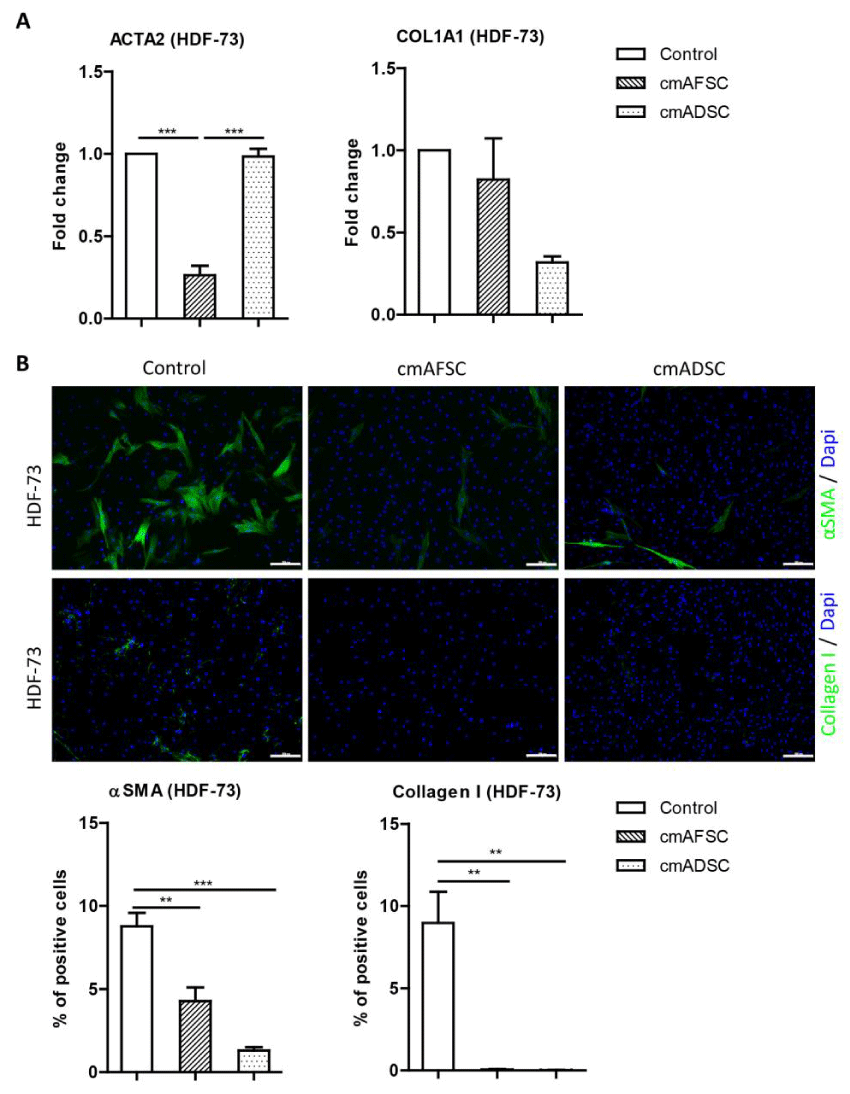
| Figure 8: Effects of cmAFSCs and cmADSCs on αSMA and collagen type I synthesis in HDF-73. Fibroblasts were treated with or without CM of AFSCs or ADSCs for 48 h. (A) mRNA levels of ACTA2 and COL1A1 were measured with qRT-PCR and expressed as fold change compared to untreated control. (B) Representative immunofluorescence stainings and quantification of the % of cells positive for αSMA and collagen type I in HDF-73 are shown. White scale bar represents 200 μm. |