 |
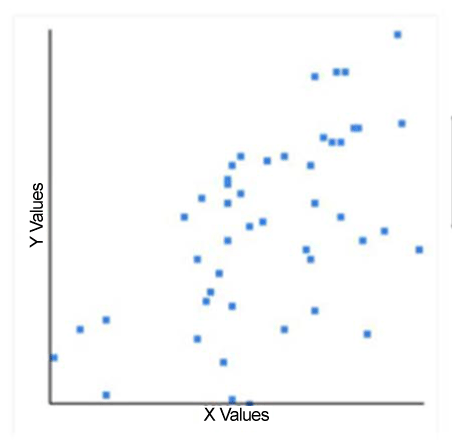
| Figure 2: Correlation between improvement of knee pain 1 year aftertreatment with MSC and initial pain score as measured with VAS-DA for the50 patients included in this study. The best-fitting line is shown with values forthe slope and linear regression coefficient (r) at the right. |