 |
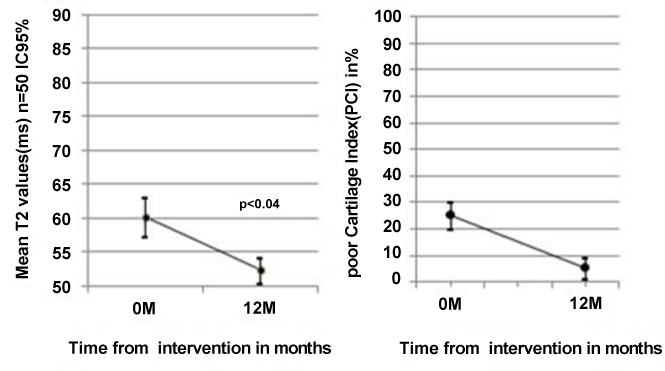
| Figure 4: Cartilage quality improvement resulting from MSC treatment. Cartilage quality was assessed by MRI T2 mapping and is quantified as Mean ms (95% IC) p<0.04 (ANOVA; Bonferroni test for paired values) and as the Poor Cartilage Index (PCI) (computed as the percentage of sample points with a T2 relaxation value >50 ms). The worse possible value for PCI is 100, and healthy cartilage should approach 5. Graph showing the temporal evolution of PCI; mean ± SE values of 50 patients treated with MSC. **p<0.01 (ANOVA; Bonferroni test for paired values). |