 |
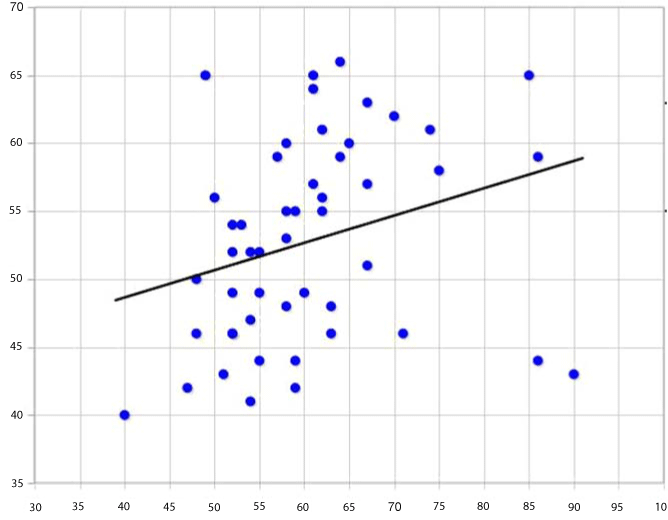
| Figure 5: Cartilage quality improvement resulting from MSC treatment. Correlation between average (ms) improvement and initial average (ms) for the 50 patients included in this study. The best-fitting line is shown with values for the slope and linear regression coefficient (r) at the right. |