 |
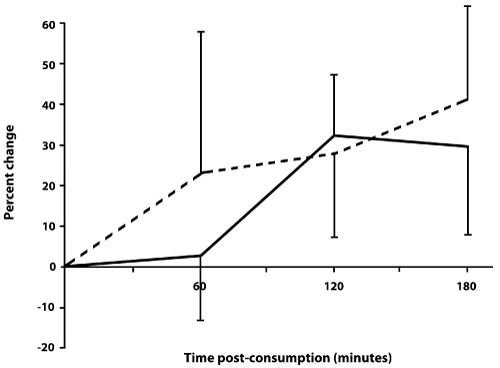
| Figure 1: The percent change in circulating CD45dim CD34+ (solid line) and CD34+ CD133+ (dashed line) stem cells following consumption of A. macroclada is shown as averages ± SEM. The percent change compared to baseline stem cell numbers in the blood circulation was calculated for each of the study participants, compensated for each person’s changes after consuming placebo, and then averaged. |