 |
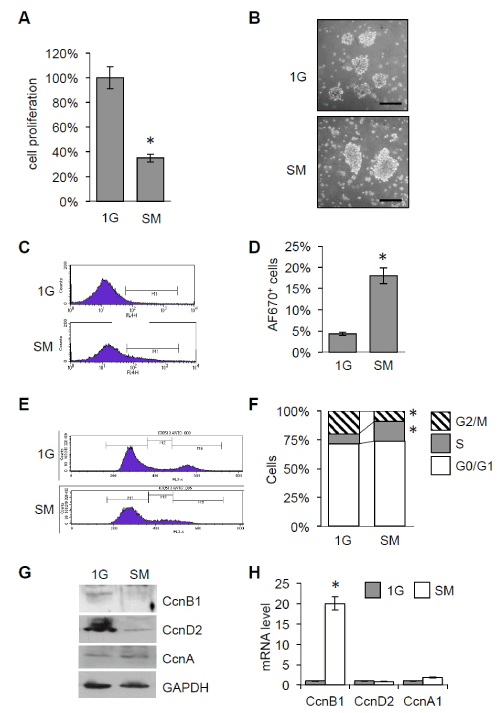
| Figure 1: Simulated microgravity induces cell cycle arrest in NSC. (A) Cell proliferation was assessed by cell count after 5 days at simulated microgravity (SM) or normogravity (1G), where 100% represent the number of cells in 1G, *p < 0.05 (B) Representative images of NSC morphology after 5 days of culture under 1G or SM. Scale μm (C) bar: Representative image of FACS analysis of Cell Proliferation Dye eFluor® 670 marked NSC exposed to SM or 1G as control. (D) Histogram showing percentage of AF670 positive cells, *p< 0.05. (E) Representative images of cell cycle profile of NSC grown in SM or 1G. (F) Graph showing the percentage of cells in given cell-cycle phases of NSC grown in SM or 1G, *p<0.05. (G) Western blot assay showing cyclins levels together with GAPDH as loading control of NSC grown in SM or 1G. (H) mRNA levels of cyclins in NSC grown in SM or 1G, *p<0.05. Experiments were performed at least in triplicate. |