 |
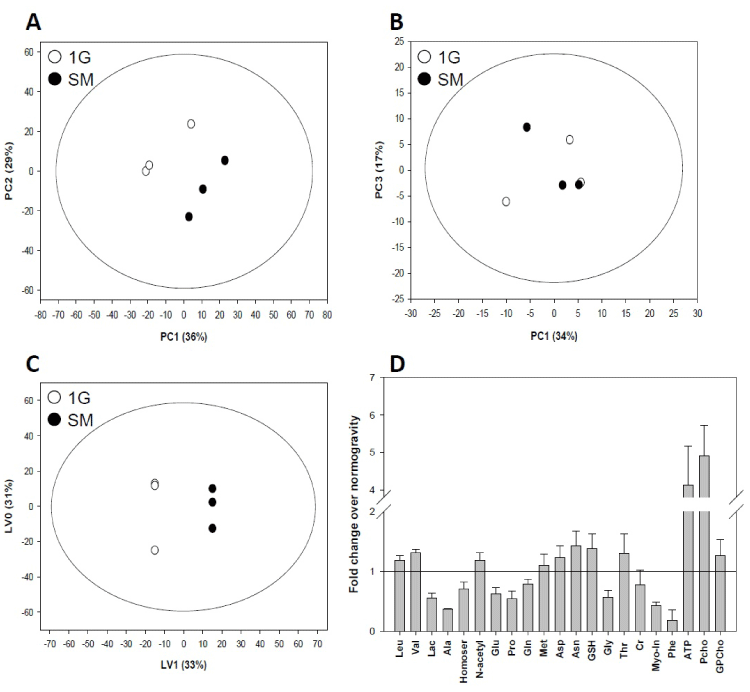
| Figure 2: Metabolic analysis of NSC exposed to simulated microgravity. (A-B) Score plots resulting from PCA analyses performed on polar (A) and nonpolar (B) metabolite datasets obtained from SM and normal gravity (1G) condition in three independent experiments. (C) Supervised analysis. (D) Discriminatory metabolites identified in SM vs 1G. Histograms indicate the relative levels of discriminatory metabolites in NSC grown in SM versus 1G as control. P<0.05 for all metabolites (Leu, leucine; Val, valine; Lac, lactate; Ala, alanine; Homoser, homoserine; N-acetyl, N-acetyl-groups, Glu, glutamate; Pro, proline; Gln, glutamine; Met, methionine; Asp, aspartate; Asn, asparagine; GSH, glutathione; Gly, glycine; Thr, threonine, Cr, creatine; Myo-In, myo-inositol; Phe, phenylalanine; ATP, Adenosine triphosphate; PCho, phosphocholine and GPCho, glycerophosphocholine). |