 |
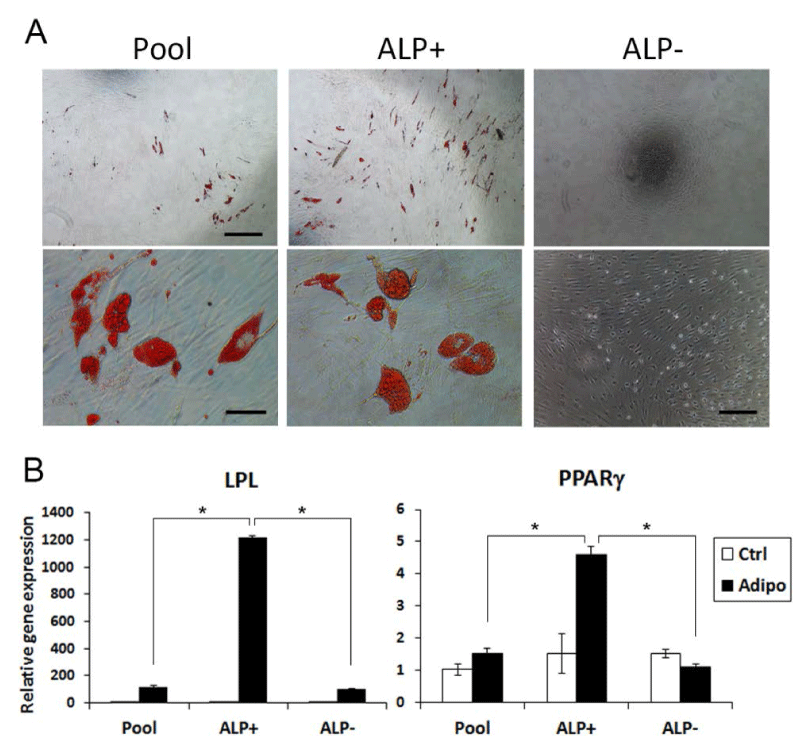
| Figure 4: Adipogenic differentiation capacities of PDLSC subpopulations. Sorted PDLSCs at passages 2-3 were immediately seeded at a density of 2×10⁴ cells/well of 24-well plates or 1×10⁴ cells/well of 48-well plates and after reaching ~70% confluence they were stimulated under the adipogenic condition. (A) Adipogenic induction of cells for 8 weeks and stained with Oil Red. Scale bars: top three images, 500 μm; bottom left and middle images, 50 μm; bottom right image, 200 μm. (B) qPCR of LPL and PPARγ in cells under adipogenic induction for 3 weeks, representative data from one donor measured in triplicate. (Significantly different, p≤0.0001*. Two-way ANOVA was performed for each gene to test the subpopulation, adipogenic condition, and their interaction effects on the gene expression. Post-hoc analysis using Tukey HSD was performed to identify the specific pairs of difference). |