 |
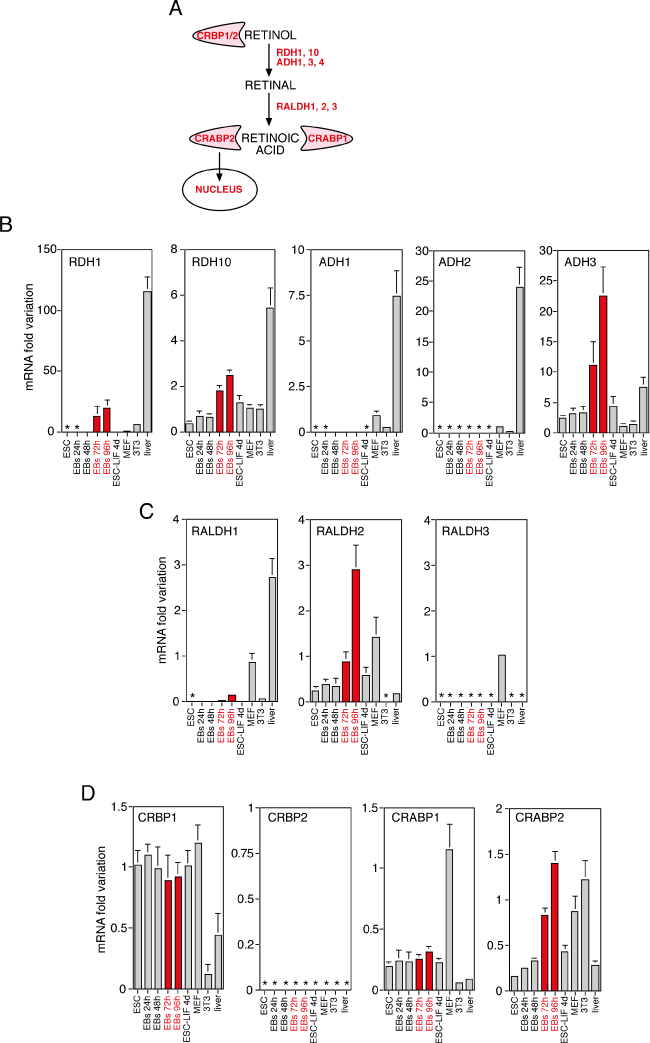
| Figure 3: Expression analysis of RA biosynthetic pathway during ESC spontaneous differentiation. (A) Schematic view of the major components of the RA biosynthetic pathway. Expression of the indicated retinol-oxidizing enzymes (B), retinal-oxidizing enzymes (C), and cellular retinoid binding proteins (D) was evaluated by RT-qPCR analysis. Values are normalized to β-Actin expression and represented as fold variation compared with primary mouse embryonic fibroblasts (MEF). Asterisk indicates undetectable levels. Data represent average ±SD of three independent experiments. |