 |
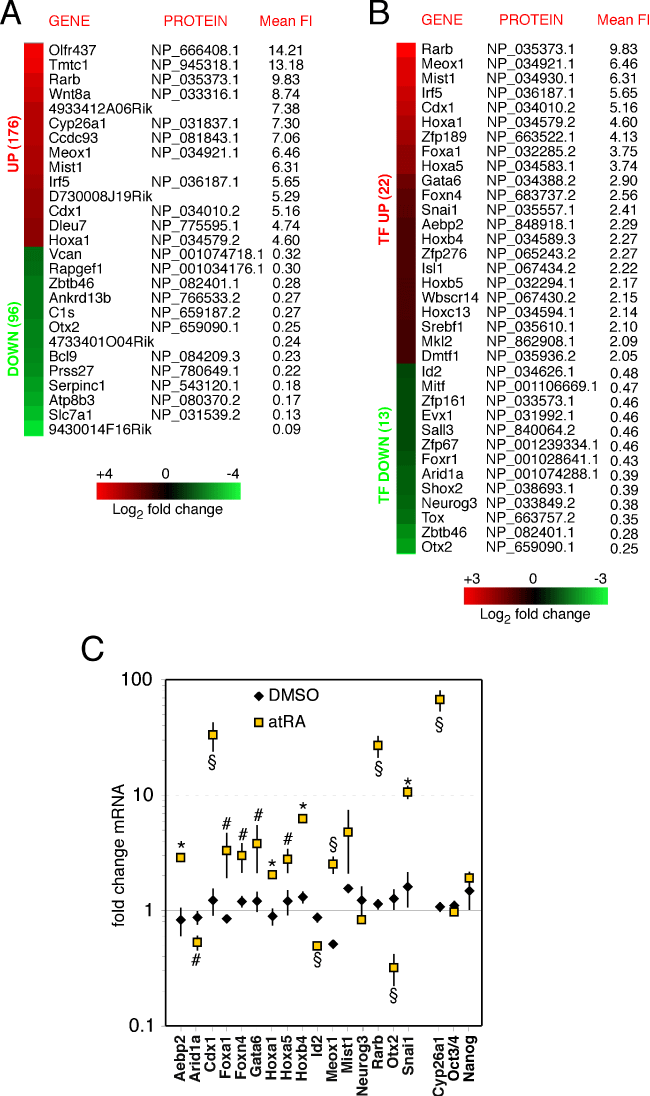
| Figure 4: Identification of early differentially expressed genes in atRA treated ESC. (A) Heat map of microarray analysis showing the top up- and down-regulated genes following 2 hours atRA treatment (FC: Fold Change). (B) Heat map of microarray analysis showing the differentially expressed TFs. (C) The microarray data of 20 selected genes were validated by RT-qPCR analysis. Up-regulated genes are represented in red, down-regulated in green and negative controls (Nanog and Oct3/4) in black. Cyp26a1 was used as positive control. Gene expression was normalized to β-Actin expression and values obtained for DMSO or atRA treated cells are represented as fold change compared with corresponding values of untreated cells. Data represent average ±SD of three independent experiments *, P<0.001; §, P<0.005; #, P<0.01 (n=3). |