|
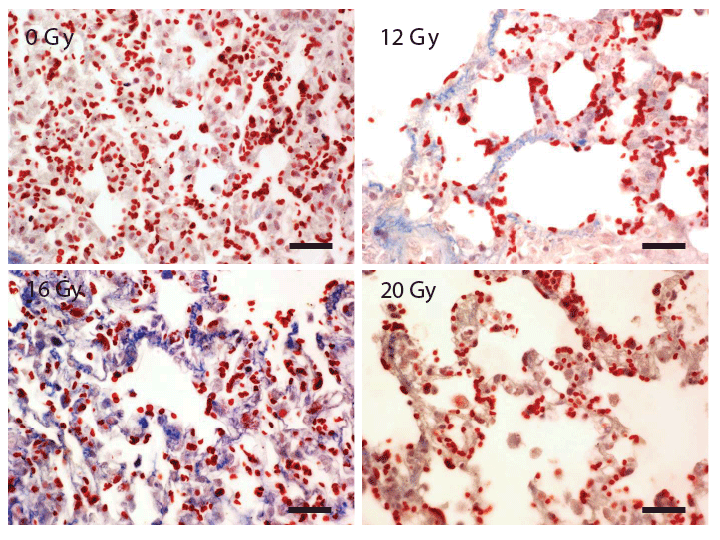
| Figure 7: Masson’s Trichrome stained micrographs to show collagen deposits and fibrosis development in each group. Control group (analyzed 16 weeks post irradiation) shows the least collagen content; 12 Gy group (analyzed 16 weeks post irradiation) shows higher collagen content compared to the control group; 16 Gy group (analyzed 16 weeks post irradiation) shows the highest collagen content; 20 Gy group (analyzed 4 weeks post irradiation) shows less collagen content compared to 12 Gy and 16 Gy groups. |