 |
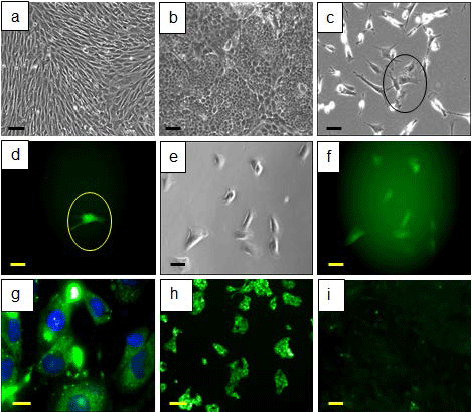
| Figure 2: (INS-GFP) expression and FACS sorting of differentiated insulin-producing cells. (a) Undifferentiated MMMbz. (b) Differentiated insulin-producing cells. (c) Differentiated cells transfected with INS-GFP expression vector. (d) INS-GFP-expressing cell (green). (e, f) Sorted INS-GFP-expressing cells plated on pre-coated plates observed with phase contrast microscope or fluorescent microscope respectively. (g) Higher magnification of INS-GFP expressing cells (green) co-stained with DAPI (blue). (h) β-TC-6 or (i) MEFs transfected with INS-GFP. (a - f, h, i) Bar = 100 μm. (g) Bar = 10 μm. |