 |
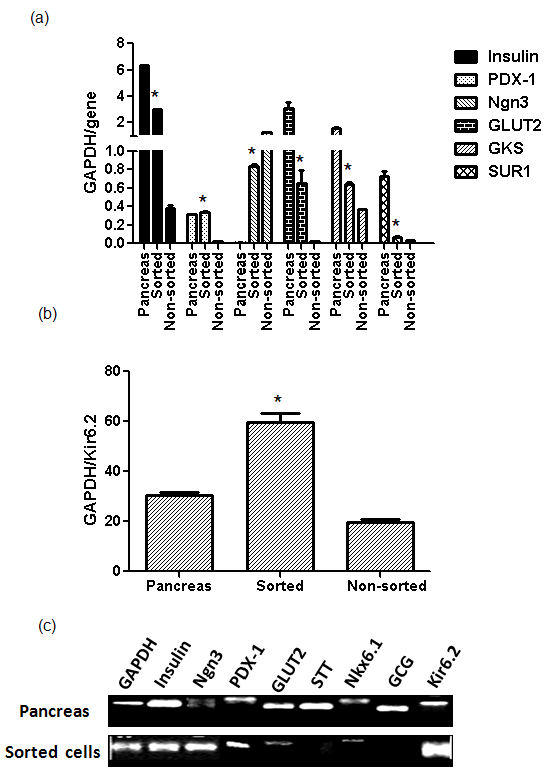
| Figure 4: Quantification of beta-cell genes in non-sorted and sorted INS-GFP-expressing cells by qRT-PCR. (a) Expression of insulin, PDX-1, Ngn3, GLUT2, GKS, and SUR1. (b) Expression of Kir6.2 indicated in a separate graph because of the amount of this marker. (c) PCR products observed by gel electrophoresis. *P < 0.05 in sorted vs. non-sorted cells. |