 |
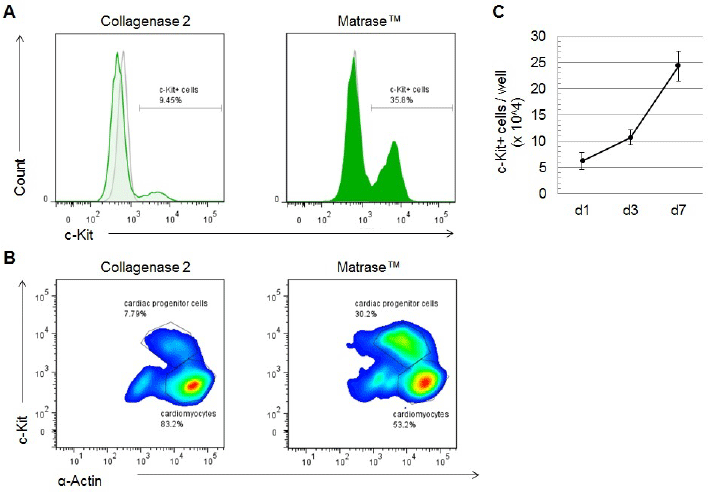
| Figure 4: Quantitative analysis of c-Kit+ cells. (A) Freshly isolated cells were stained for c-Kit and α-actin and analyzed by flow cytometry. C-Kit-expression is more than 3-fold higher in the cell isolate after enzymatic dissociation using Matrase™. The gray histogram represents the unlabeled control. (B) Co-staining with α-actin reveals different populations within the cell isolate. C-Kitlow/α-actinhigh cells are considered cardiomyocytes and represent the largest cell fraction in both isolation products. The population of c-Kithigh cells shows lower abundance of α-actin and is significantly higher after tissue processing with Matrase™. (C) In three sets of experiments, cells obtained from primary isolation were cultured in cardiomyocyte growth conditions and analyzed for c-Kit-expression after 1, 4 and 7 days. The constant increase of c-Kit+ cells indicates stable c-Kit- expression and maintenance of CPCs in culture. |