|
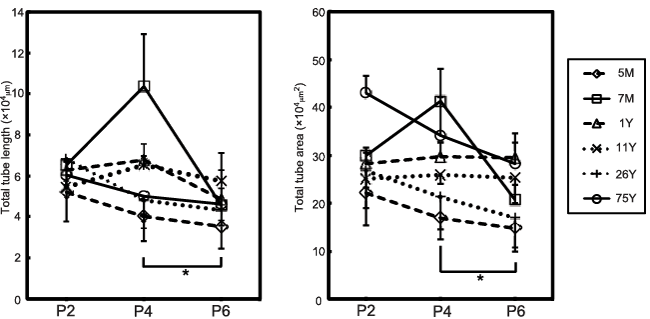
| Figure 5: Changes in the tube formation capacity of ASC-CM according to passage number. Using six donor-derived ASC-CM samples that were serially collected at passages 2, 4, and 6 (P2, P4, and P6), changes in the ASC-CM-induced tube formation capacity were compared for each passage. Data shown are the mean ± SD of results from triplicate dishes. *p < 0.05 (Friedman's ANOVA and Wilcoxon signed-rank test). |