 |
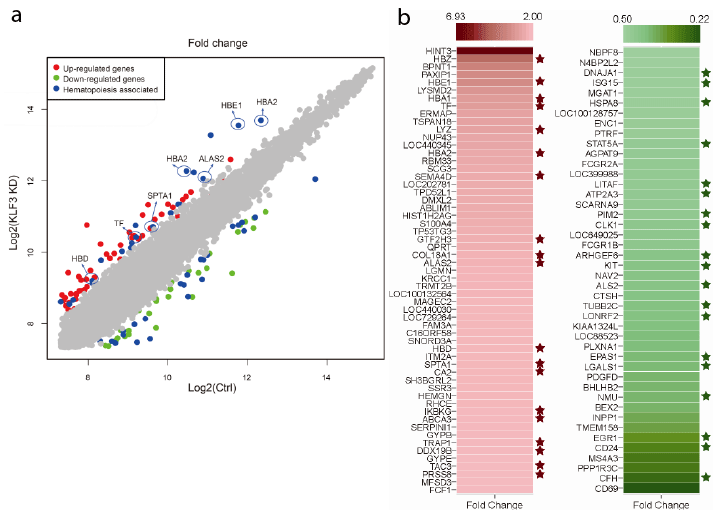
| Figure 2: Hematopoiesis-associated genes were affected by KLF3 deficiency in K562 leukemia cells. (a) Scatter plot of DEGs compared with unchanged genes. Red and green dots are the up-regulated and down-regulated genes (> 2-fold change, P < 0.01), respectively. Blue dots are differentially expressed hematopoiesisassociated genes in KLF3-deficient K562 cells identified by GO analysis. (b) Heatmap analysis of the affected genes in KLF3-deficient K562 cells. The asterisks indicate the perturbed hematopoiesis-associated genes in KLF3-deficient K562 cells. Red: upregulated genes, Green: down-regulated genes. |