 |
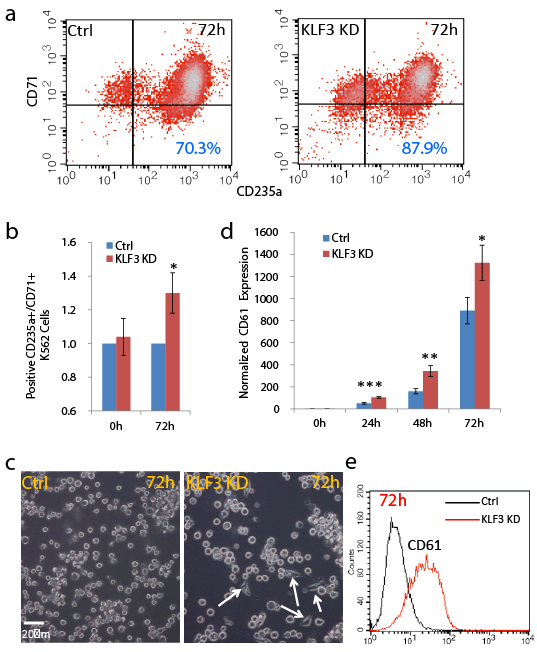
| Figure 4: KLF3 deficiency promotes erythroid differentiation and megakaryocyte differentiation of K562 leukemia cells. (a) Representative FACS analysis of KLF3 deficient K562 cells and control shRNA transfected cells following hemin induction for 72 h. (b) Summary of FACS data showing the CD71+/CD235a+ population between KLF3-deficient and shRNA control K562 cells after hemin induction at 72 h. The CD71+/CD235a+ population in KLF3-deficient cells was normalized to that of shRNA control cells. (c) PMA induced morphological changes of KLF3-deficient K562 cells. PMA induced K562 cells were analyzed under a microscope at 72 h. The white arrows indicate the cells with dramatic morphological changes toward megakaryocyte differentiation. Magnification, 20×. (d) KLF3 deficiency triggers significantly increased expression of the megakaryocyte surface marker CD61 compared to shRNA control cells. Aliquots were isolated at the indicated time points and analyzed by qPCR. The CD61 expression was normalized to that of shRNA control cells at the indicated time points. The statistical significance of differences between KLF3- deficient and shRNA control cells was analyzed using the Student’s t-test. ***: P<0.001, **: P<0.01, *: P<0.05; n=3. (e) Representative FACS analysis of KLF3- deficient K562 cells and shRNA-transfected control cells following PMA induction for 72 h. |