 |
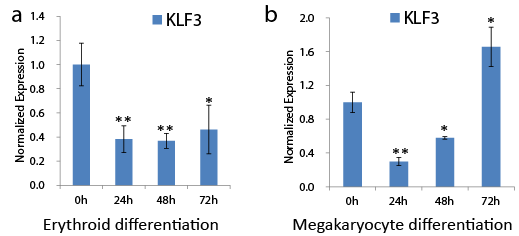
| Figure 5: KLF3 expression changes during erythroid differentiation and megakaryocyte differentiation of K562 cells (a) The expression profile of KLF3 during erythroid differentiation of K562 cells. Aliquots were isolated at the indicated time points for qPCR analysis. The gene expression was compared to that of the control sample without hemin induction. The statistical significance of differences between hemin-induced and uninduced cells was analyzed using the Student’s t-test, a value of p<0.05 indicated statistical significance. (b) The expression profile of KLF3 during megakaryocyte differentiation of K562 cells. K562 cells were treated with 20 nM PMA to initiate megakaryocyte differentiation. The gene expression was compared to that of the control sample without PMA induction. The statistical significance of differences between PMA-induced and uninduced cells was analyzed using the Student’s t-test, a value of P<0.05 indicated statistical significance. |