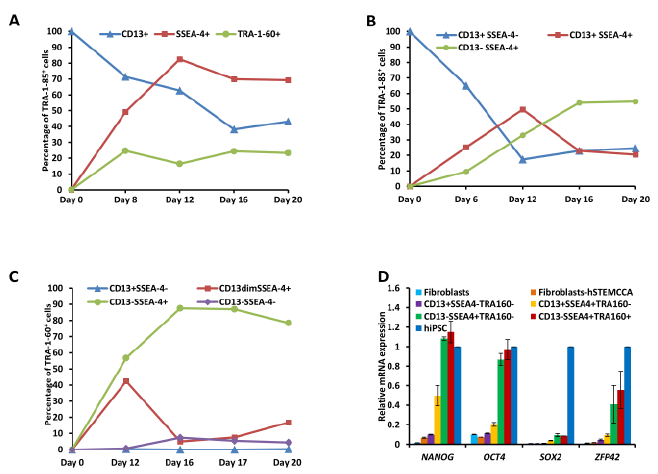
(A) Percentages of CD13+, SSEA-4+ and TRA-1-60+ cells on different days of reprogramming in the TRA-1-85+ population of cells. Percentages of the cells that co-express CD13 and SSEA-4 (B) in the TRA-1-85+ population of cells and (C) in the TRA-1-60+ fraction of cells. (D) Real-time PCR analysis of mRNA levels of pluripotency markers, NANOG, OCT4, SOX2 and ZFP42 in hADFs, in the cells 6 days after infecting with hSTEMCCA lentiviruses and the cell fractions sorted by flow cytometry based on the expression of CD13, SSEA-4 and TRA-1-60 (n=2). The fold changes were calculated relative to expression levels in hiPSCs.