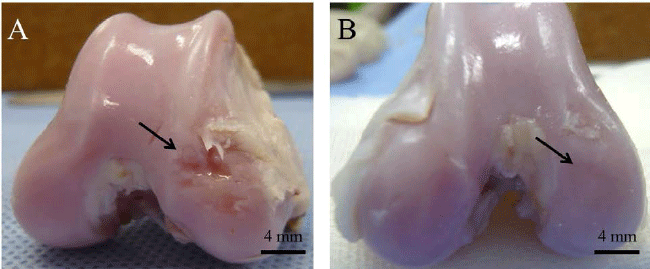
Figure 2:
Macroscopic observation of the defects at 12 weeks after the injection. The black arrows show the defects or repaired tissues.
A:
control group;
B:
the group injected with 5 × 10
6
cells and 0.01% HA. (Scale bars=4 mm).