 |
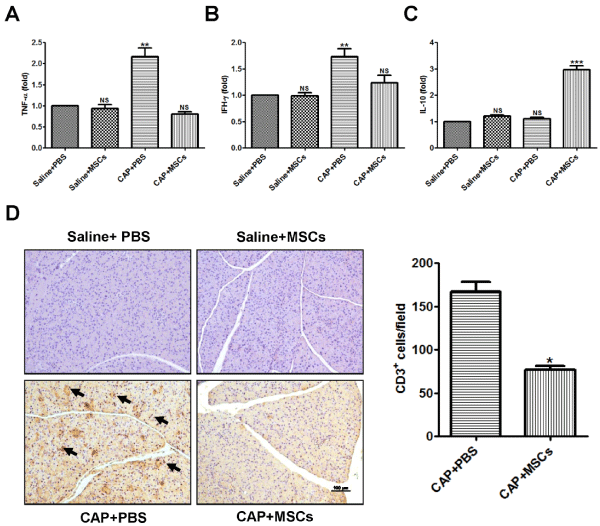
| Figure 4: Immunomodulatory effects of msp-MSCs in CAP mice. TNF-α (A), IFN-γ (B), and IL-10 (C) mRNA expression level was analyzed using qRT-PCR. (D) Inhibition of CD3+ T cell infiltration by msp-MSCs in pancreas tissues. Original magnification, 100×; scale bar, 100um. Black arrows indicate infiltrated CD3+ T cells. Values represent the means ± SE of three independent experiments. NS, not significant; *, P<0.05; **, P<0.01; ***, P<0.001 compared with Saline+PBS group. CAP, cerulein-induced acute pancreatitis; msp-MSCs, mouse spleen-derived mesenchymal stem cells. |