 |
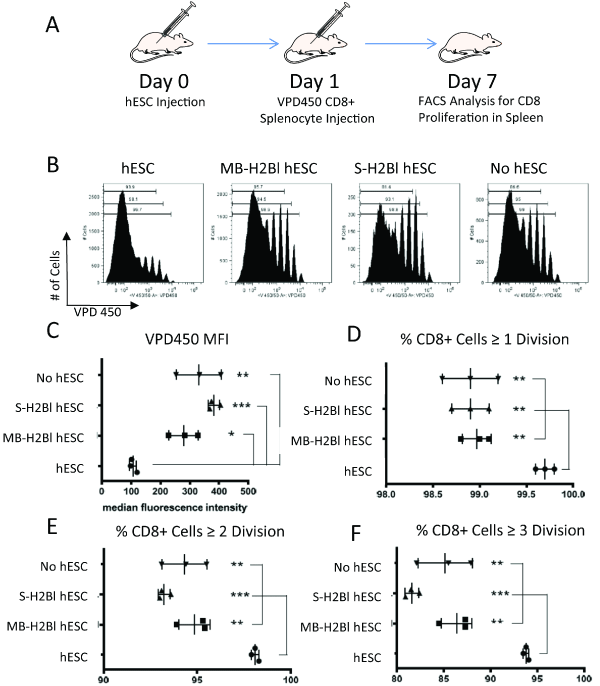
| Figure 5: H2-Bl S and MB inhibit CD8+ T cell proliferation. (A) Schematic representation of experiments. (B) Representative flow cytometry histograms of VPD450 in CD8+ cells from the spleen of recipients. (C) CD8+ splenocyets injected in recipients containing ES cells expressing either S-H2Bl or MB-H2Bl showed a decrease in the median florescence intensity of VPD. (D-F) CD8+ cell proliferation was significantly lower in when injected into mice containing ES cells expressing either S-H2Bl or MB-H2Bl relative to control ES cells, and was similar to that seen in mice that had not received ES cell injections. (n=3, * p<0.05, ** p<0.01, *** p<0.001). |