 |
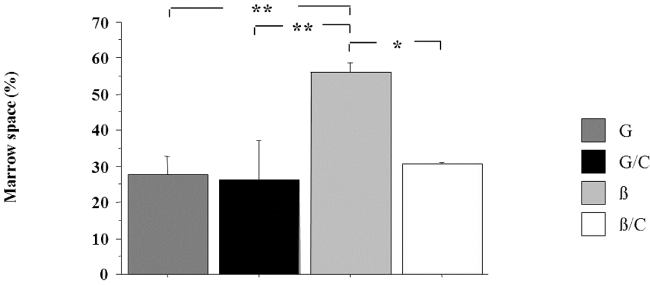
| Figure 4: Percentage of marrow space in the cranial defects of the four experimental groups: ß-TCP (ß); ß-TCP/DPSC (ß/C); GDPB(G) and GDPB/ DPSC(G/C). Values are expressed as a percentage of marrow space on the total area of the defect. Data represent means ± SEM. Asterisks indicate significant differences between time groups (*p<0.05; **p<0.01). ß-TCP: Beta-tricalcium phosphate; GDPB: Granular deproteinized bovine bone; DPSC: Dental pulp stem cells. |