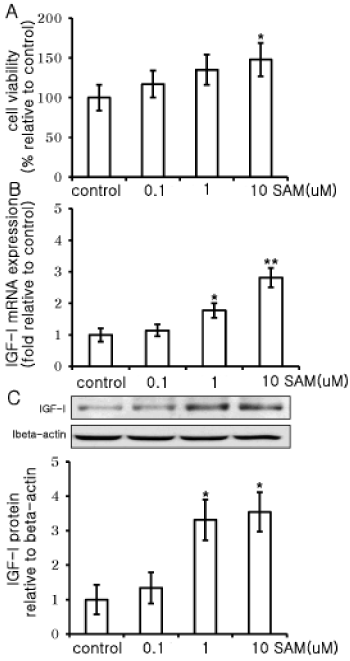
| Cells were treated with different concentrations of SAM (0, 0.1, 1 and 10 μM) for
24 h. Cell viability was measured with an MTT assay (A). This expression is
expressed as the mean ± SD of the fold- and percent-increases over that of
the control. IGF-I mRNA expression was expressed as a fold-increase over
that of the control using real-time PCR (B). IGF-1 protein expression was
determined using immunoprecipitation and Western blot analysis (C). The
mean intensity was measured with densitometry (n=8). Statistical analysis;
*p<0.05 and **p<0.05 vs. negative control (control media alone). |