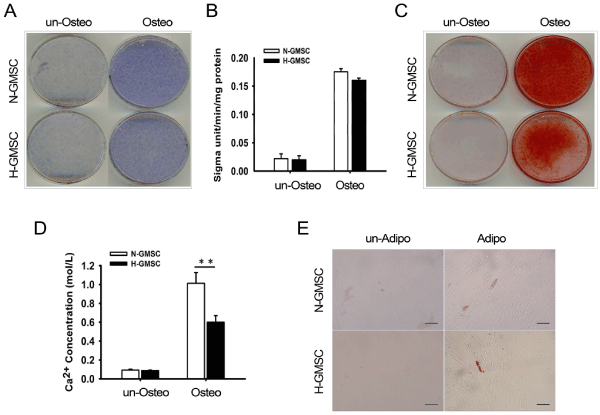
(B) ALP activity in N-GMSCs and H-GMSCs did not differ (n=5, P<0.1; Student’s t test).
(C) Alizarin red S staining of N-GMSCs and H-GMSCs under osteogenic induction.
(D) Calcium concentrations in N-GMSCs were higher than in H-GMSCs (n=5, P<0.01; Student’s t test).
(E) Oil red O staining of N-GMSCs and H-GMSCs under adipogenic induction (scale bar=200 μm).