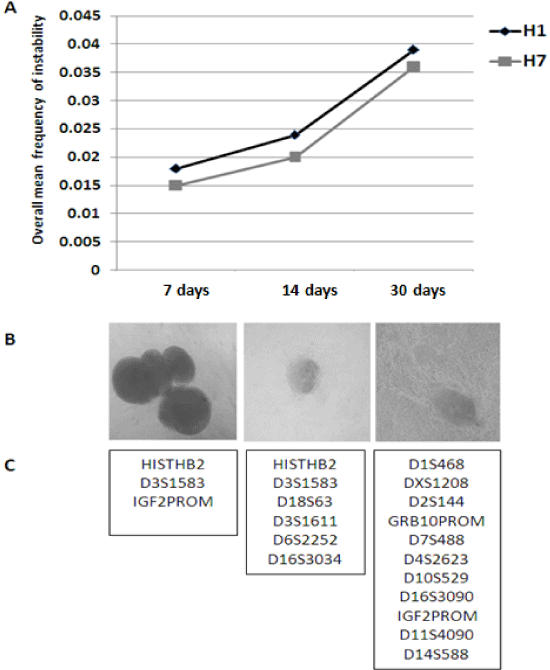
| (A) EBs from H1 and H7 ES cell lines showed statistically significant
differences of frequencies of unstable markers at 7 days after in vitro
differentiation when compared to frequencies of unstable markers at 30
days after in vitro differentiation (p<0.05). Values represent the overall mean
frequency of unstable markers over three points of time. (B) Phase contrast
image of EBs in suspension at 7, 14, and 30 days after in vitro differentiation
(magnification of 10X) (C) List of unstable markers at 7, 14, and 30 days after
in vitro differentiatio |